
Your data has a story.Let's map it.
We turn complex geospatial data into interactive maps, dashboards, and animations that people actually understand — and love to use.
000.0000° W
Explore what we can do for you
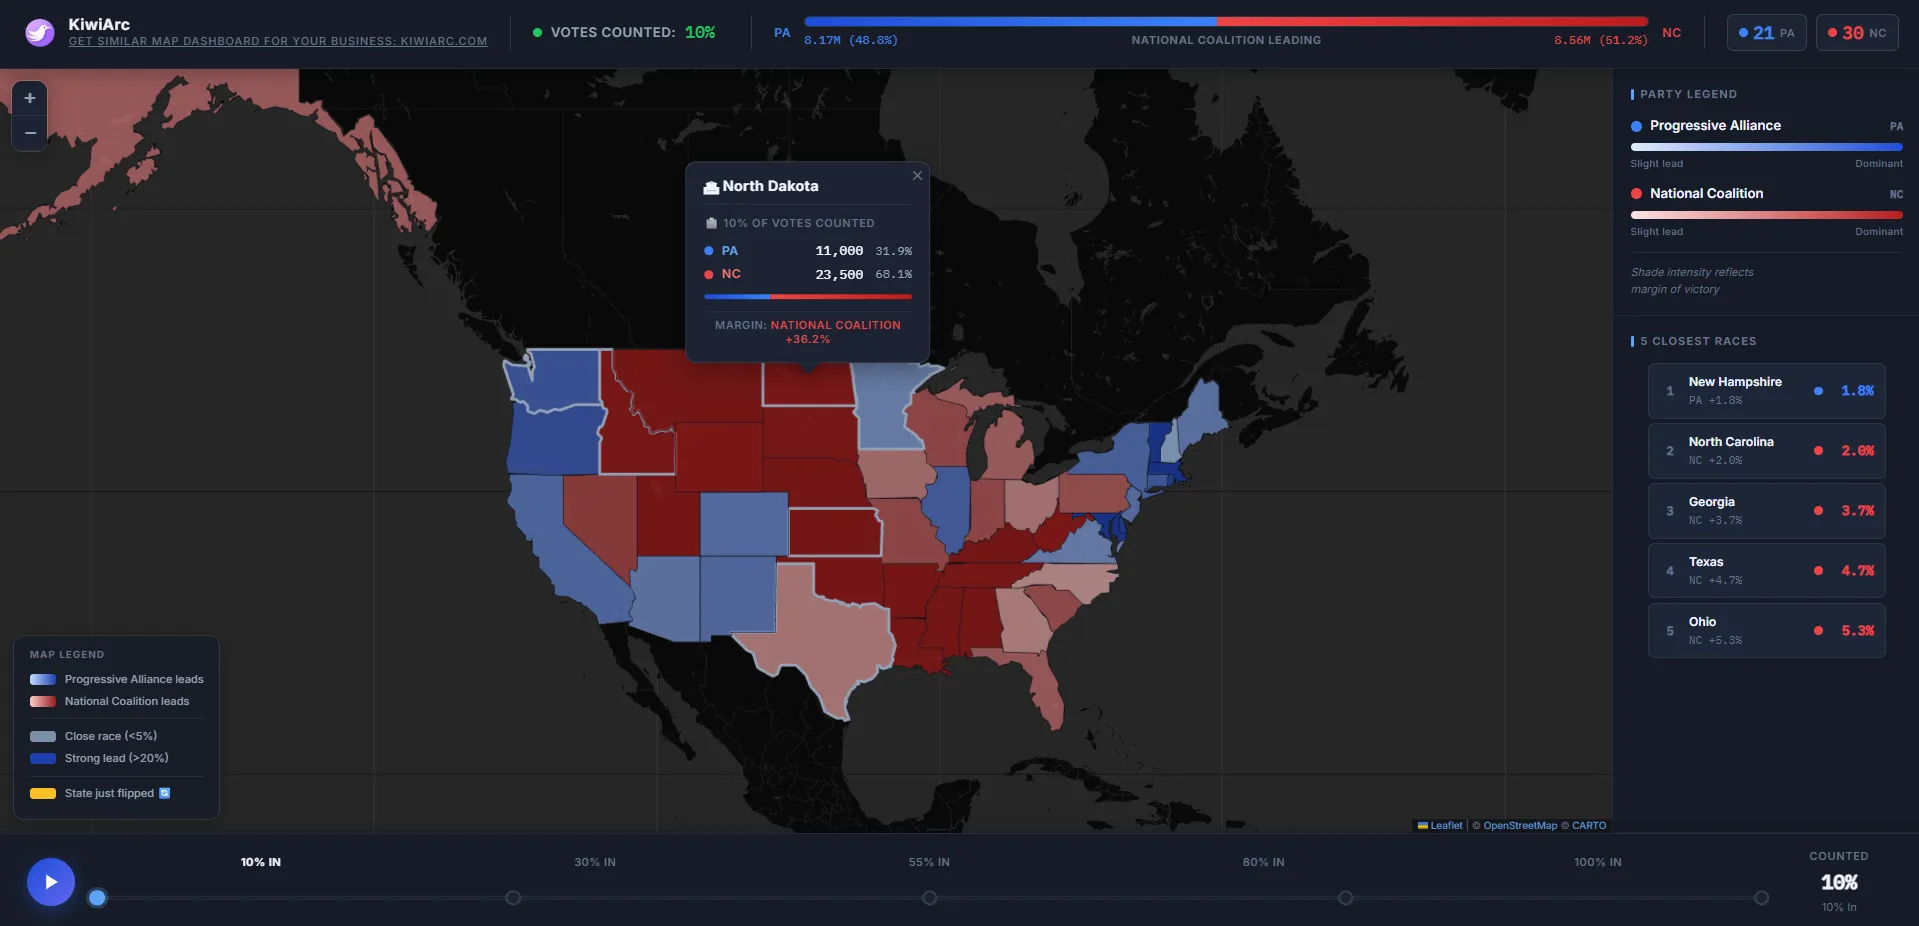
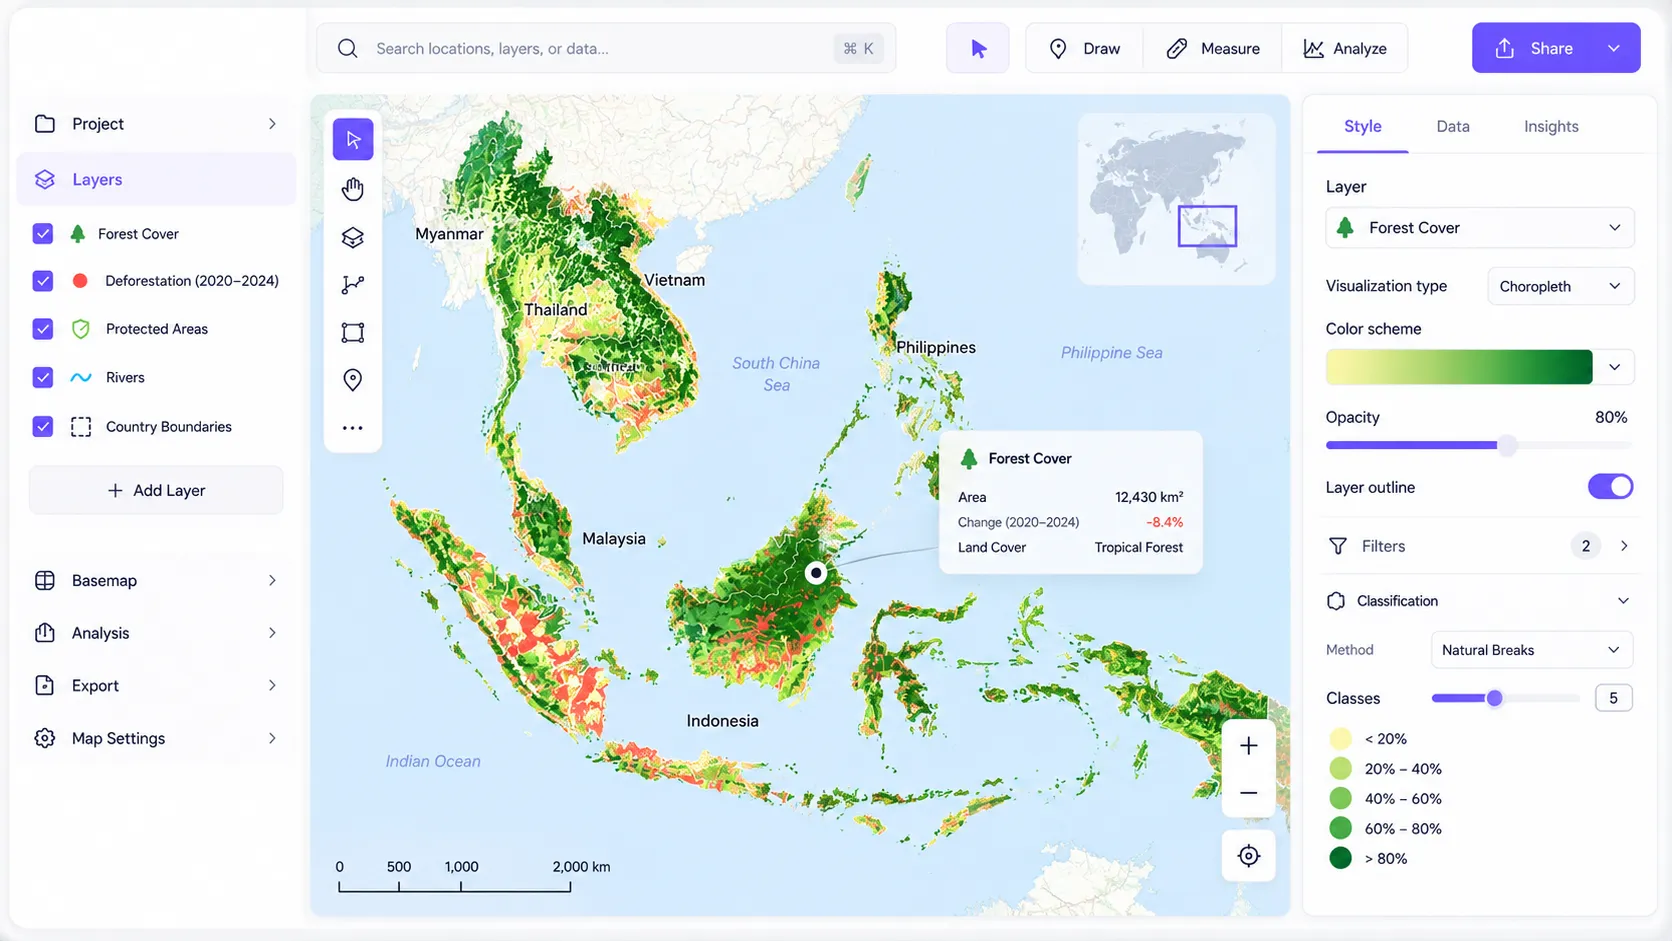
INTERACTIVE MAPS
Web MappingWe build high-performance interactive maps for websites, research portals, and organizational platforms. Designed to be fast, responsive, and easy for your audience to explore without requiring specialized software.
View ProjectsCapabilities
- Custom Mapbox / Leaflet Integration
- Vector Tile Rendering
- Interactive Points of Interest
- Data Filtering & Overlays
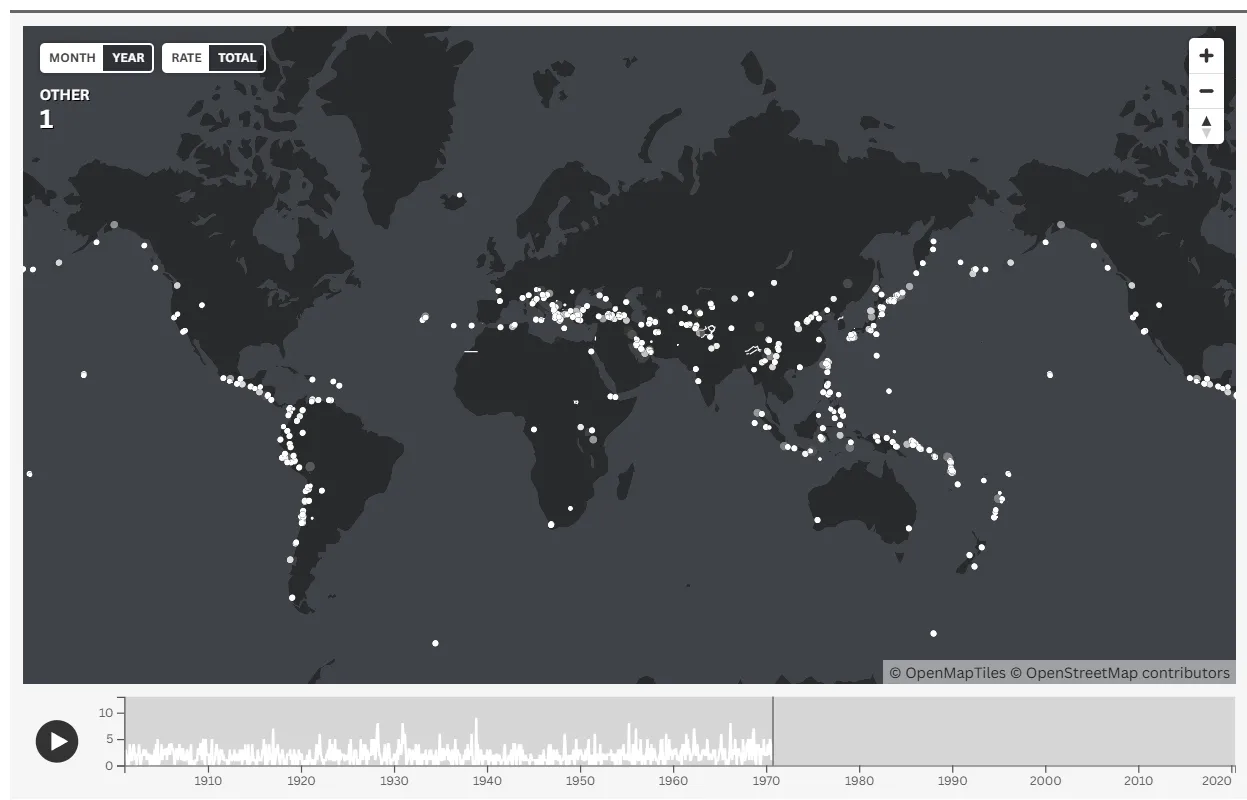
MAP ANIMATION
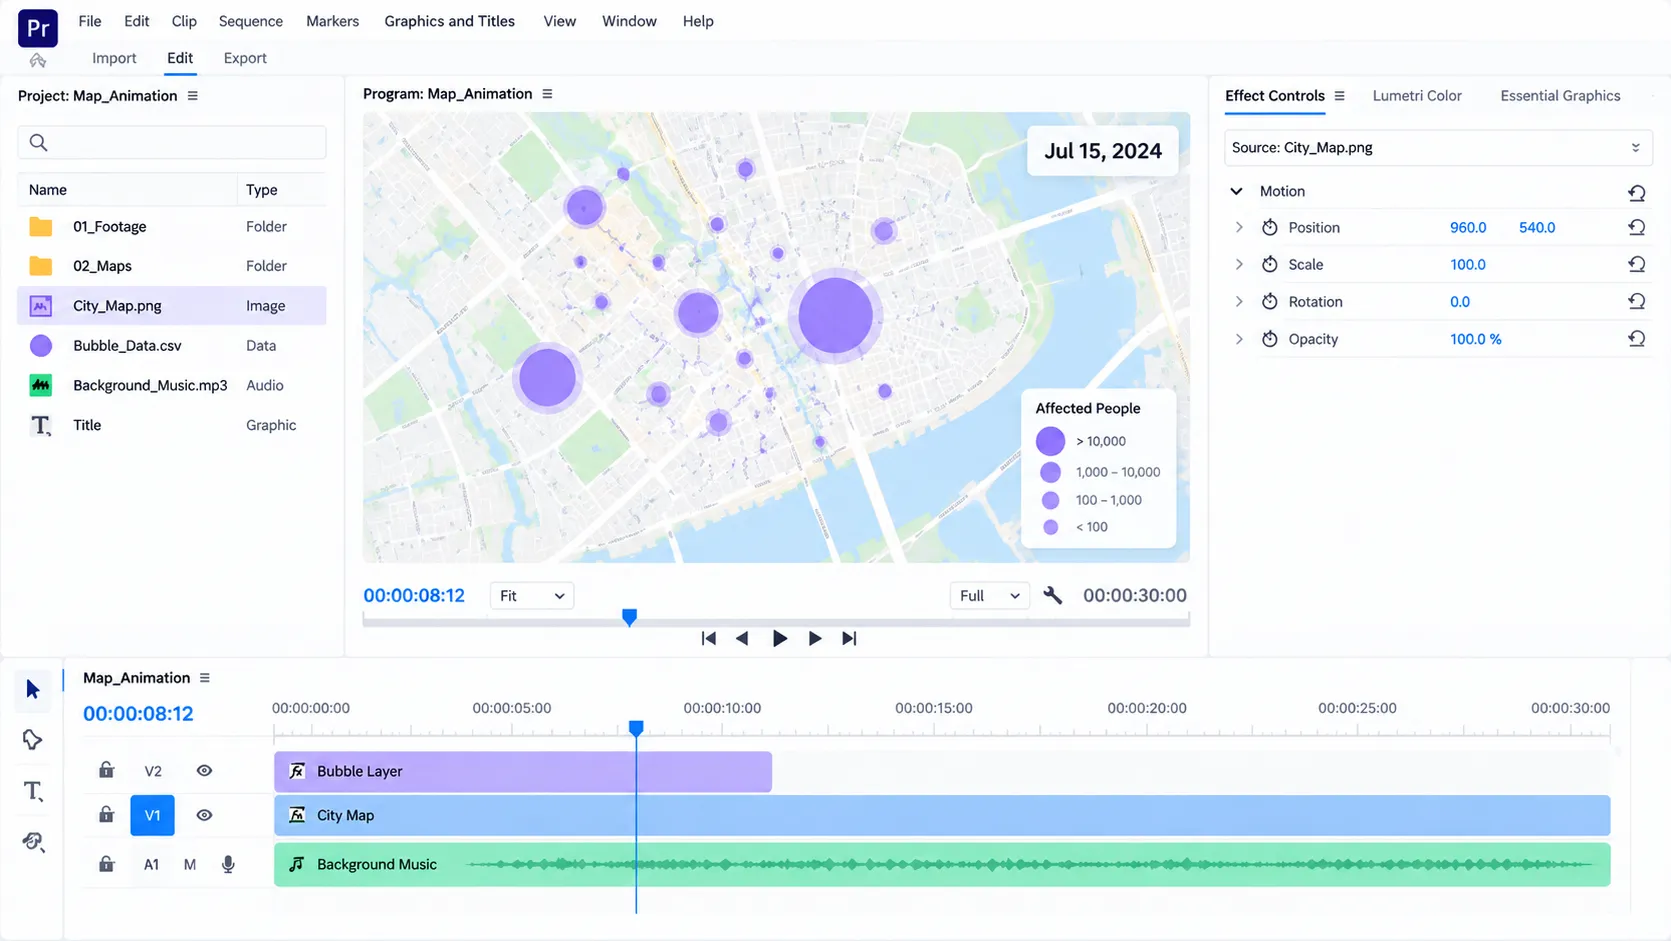
Motion & StorytellingAnimated maps that explain movement, timelines, and geographic change with smooth, presentation-ready visuals. Perfect for documentaries, marketing videos, and keynote presentations.
View ProjectsCapabilities
- 2D & 3D Fly-throughs
- Historical Timelines
- Route & Flow Animations
- Broadcast-Ready Exports
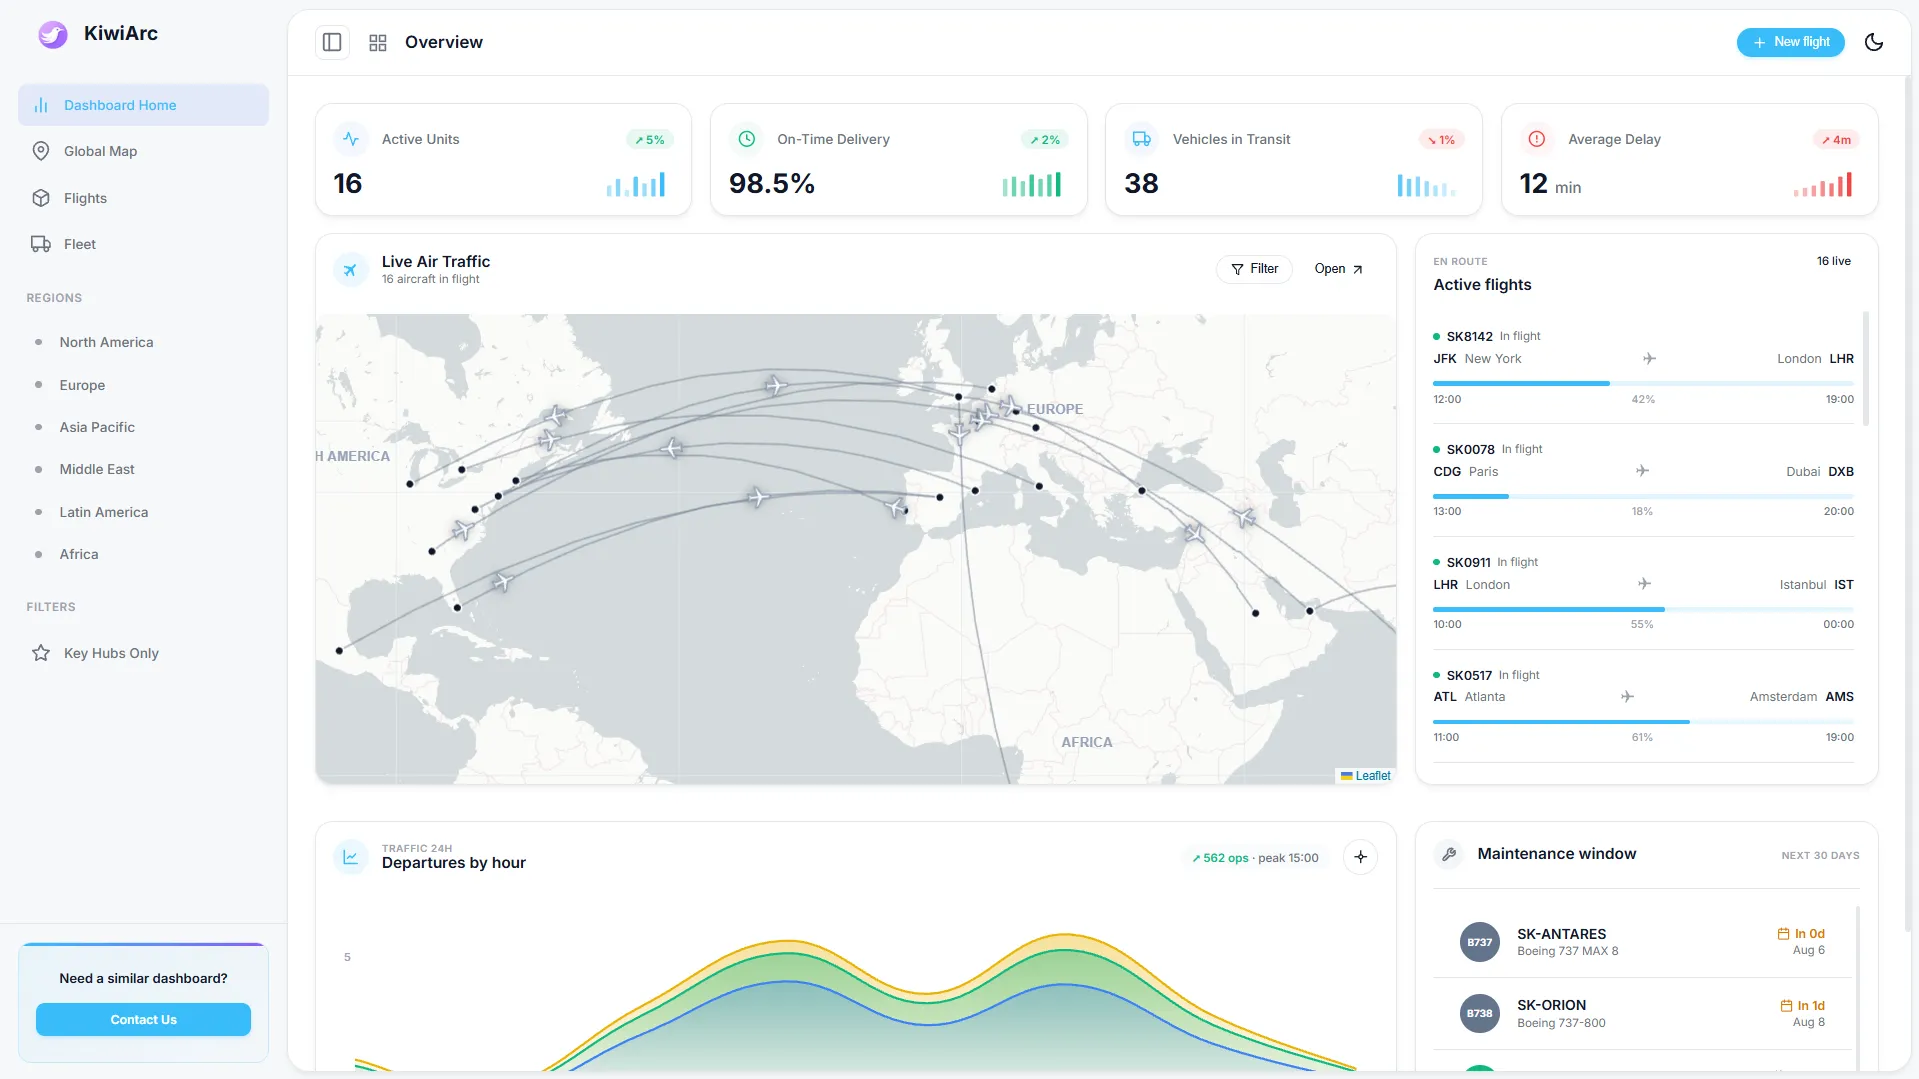
WEB DASHBOARDS
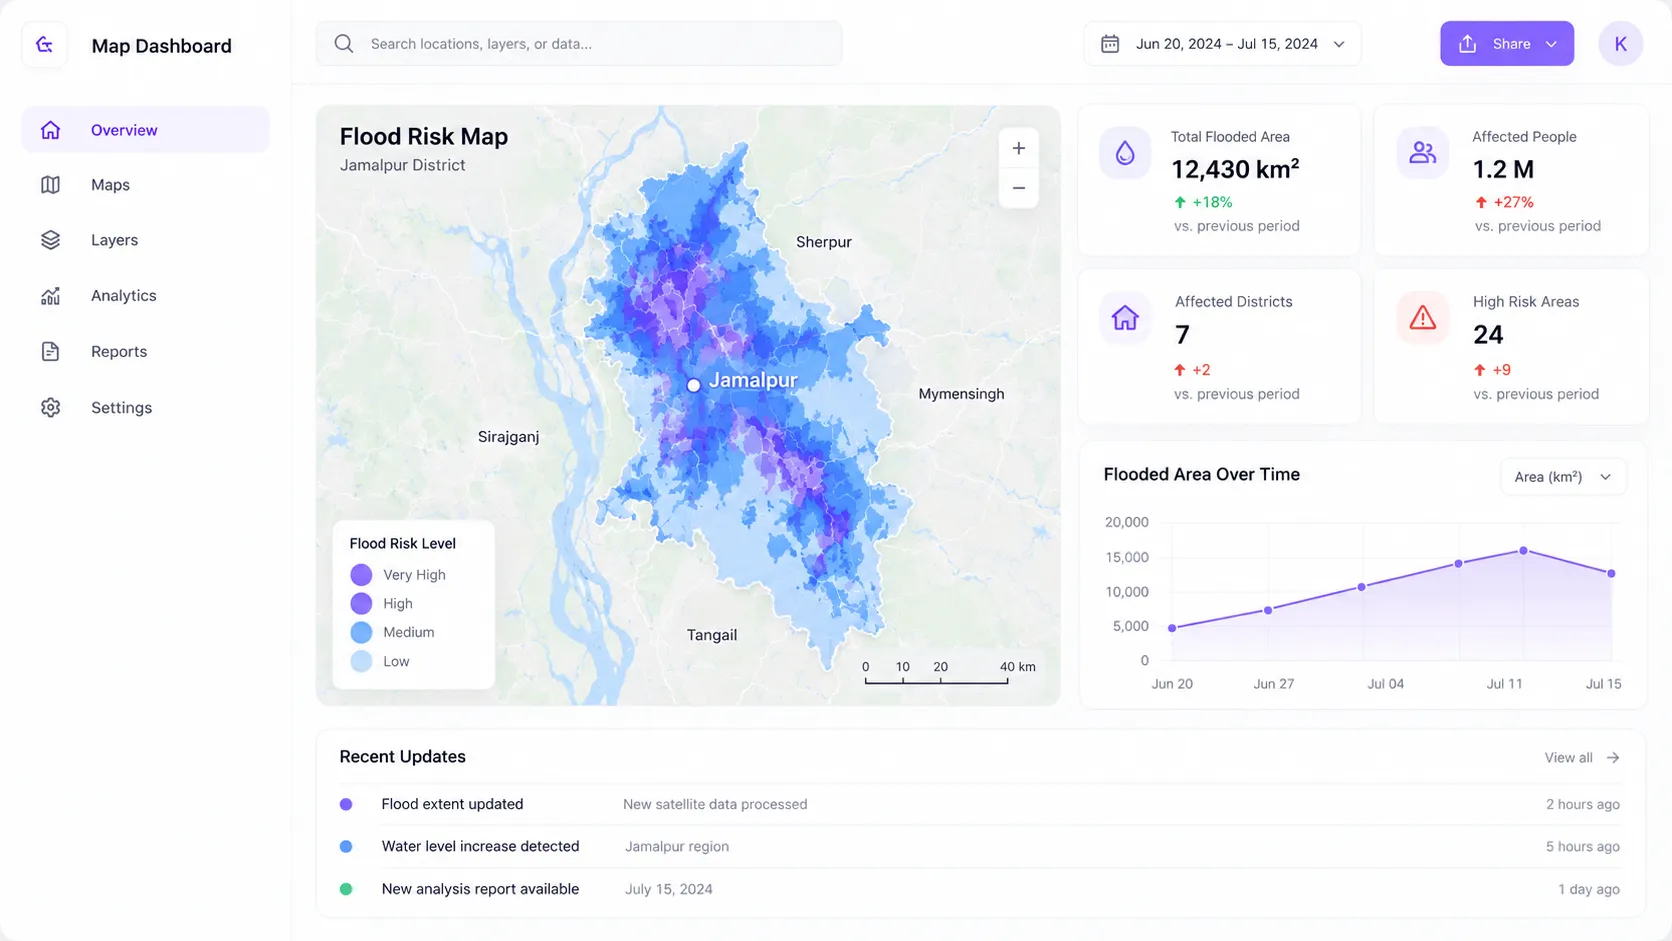
Data VisualizationInteractive dashboards that combine maps, charts, and key performance indicators into one clean interface. We turn complex datasets into actionable, real-time reporting tools.
View ProjectsCapabilities
- Geospatial BI Panels
- Real-time Data Feeds
- Custom Charting (D3/Recharts)
- Secure Access Controls
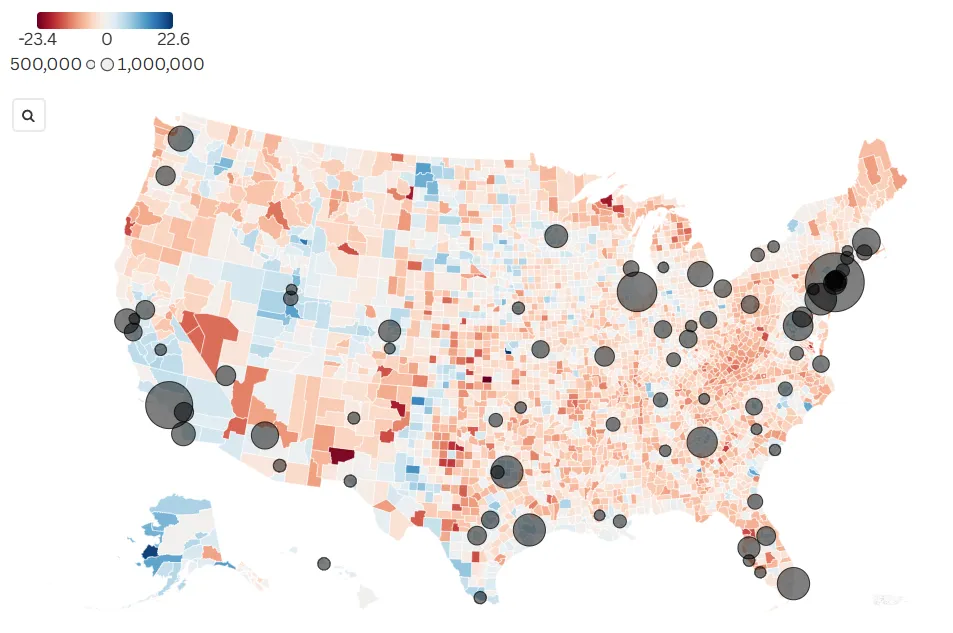
GIS & REMOTE SENSING
Spatial AnalysisAdvanced spatial analysis, satellite imagery processing, terrain modeling, and publication-ready GIS outputs for researchers, urban planners, and environmental organizations.
View ProjectsCapabilities
- Satellite Image Processing
- Topographic & Terrain Modeling
- Suitability Analysis
- Static Publication Maps
Strategic steps to impactful results
Discovery
Understanding goals, audience, available data, and project objectives.

Data Preparation
Organizing datasets, cleaning information, and preparing technical foundations.

Design & Development
Creating interactive maps, dashboards, animations, or GIS solutions with continuous collaboration.

Review & Refinement
Testing, gathering feedback, making revisions, and polishing every detail.

Launch & Support
Final delivery, deployment, documentation, and optional long-term support.

The right tools
for every project.
Interactive Maps
Map Animation
Web Dashboards
GIS & Remote Sensing
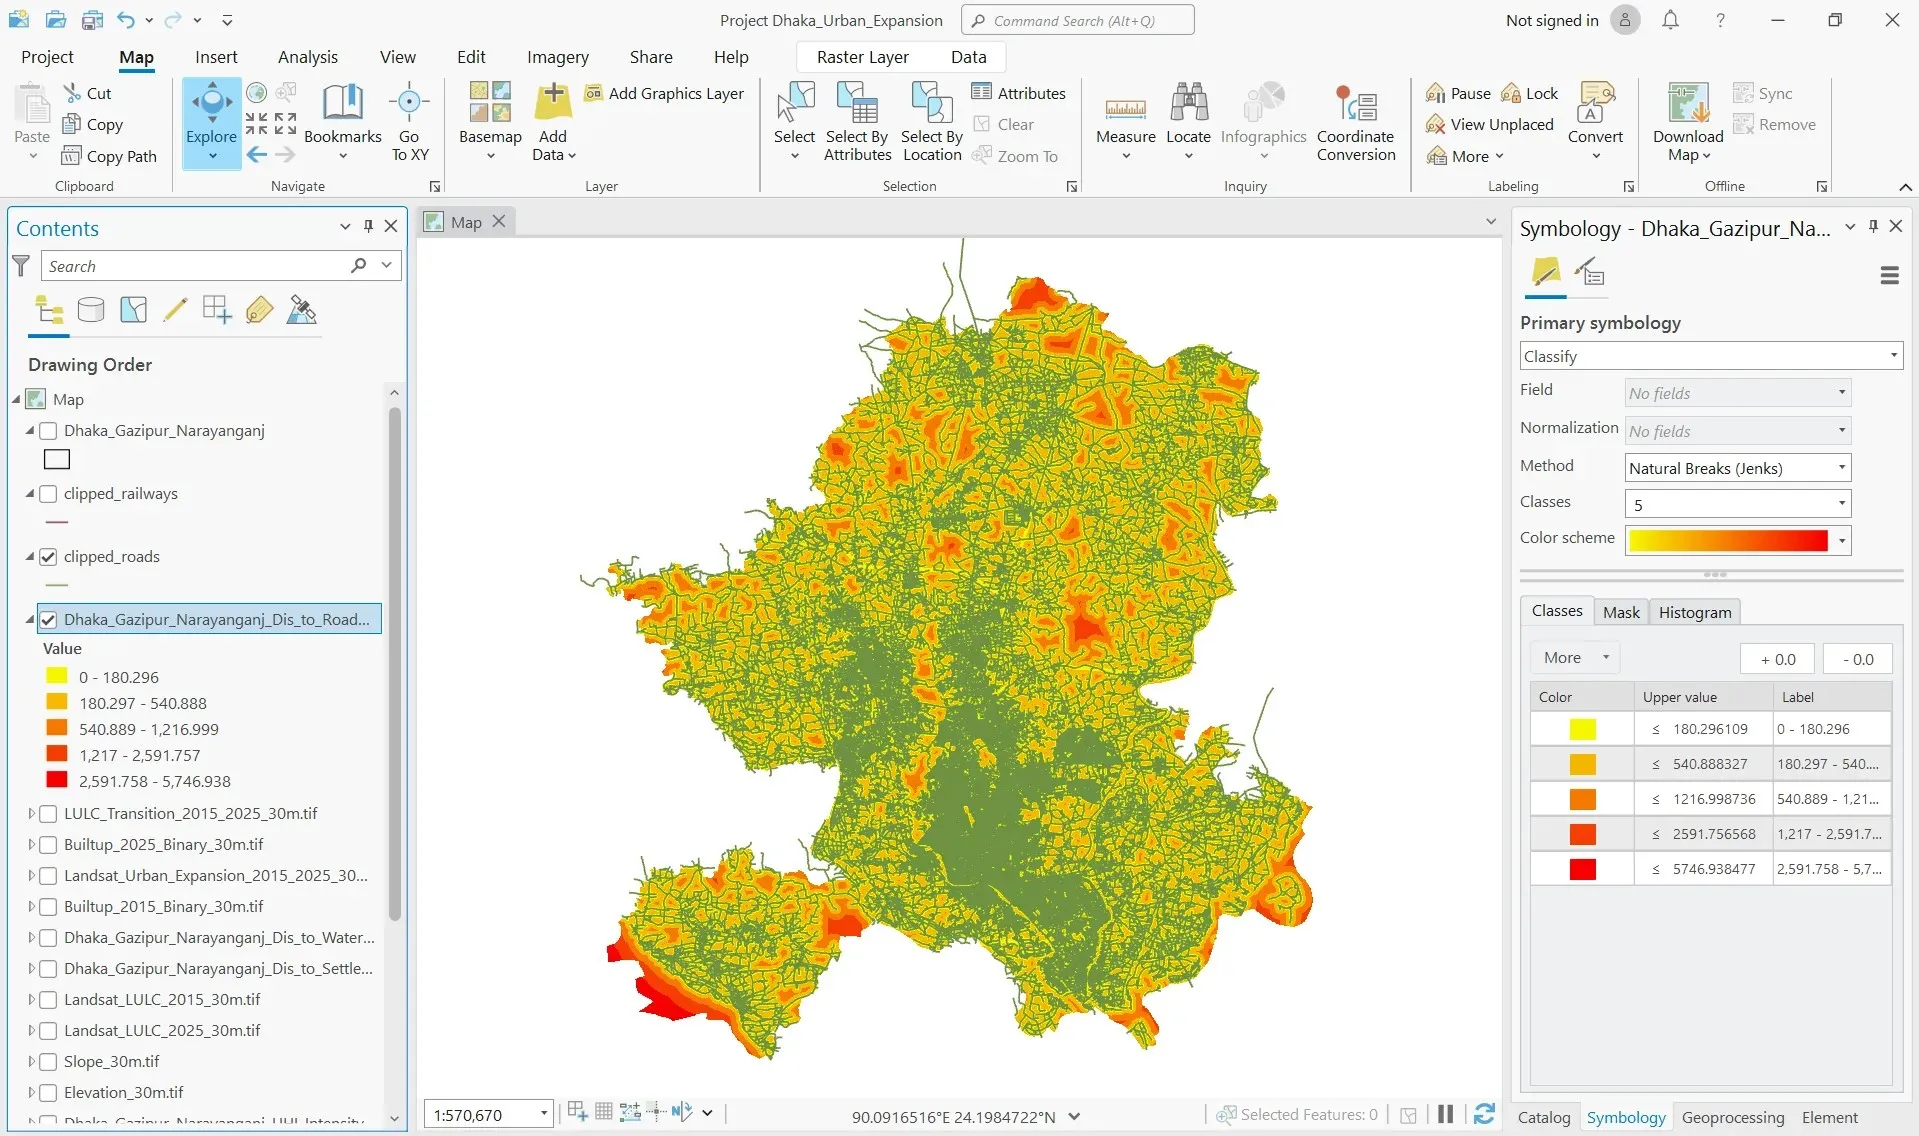
SHOWCASING OUR MOST IMPACTFUL WORK
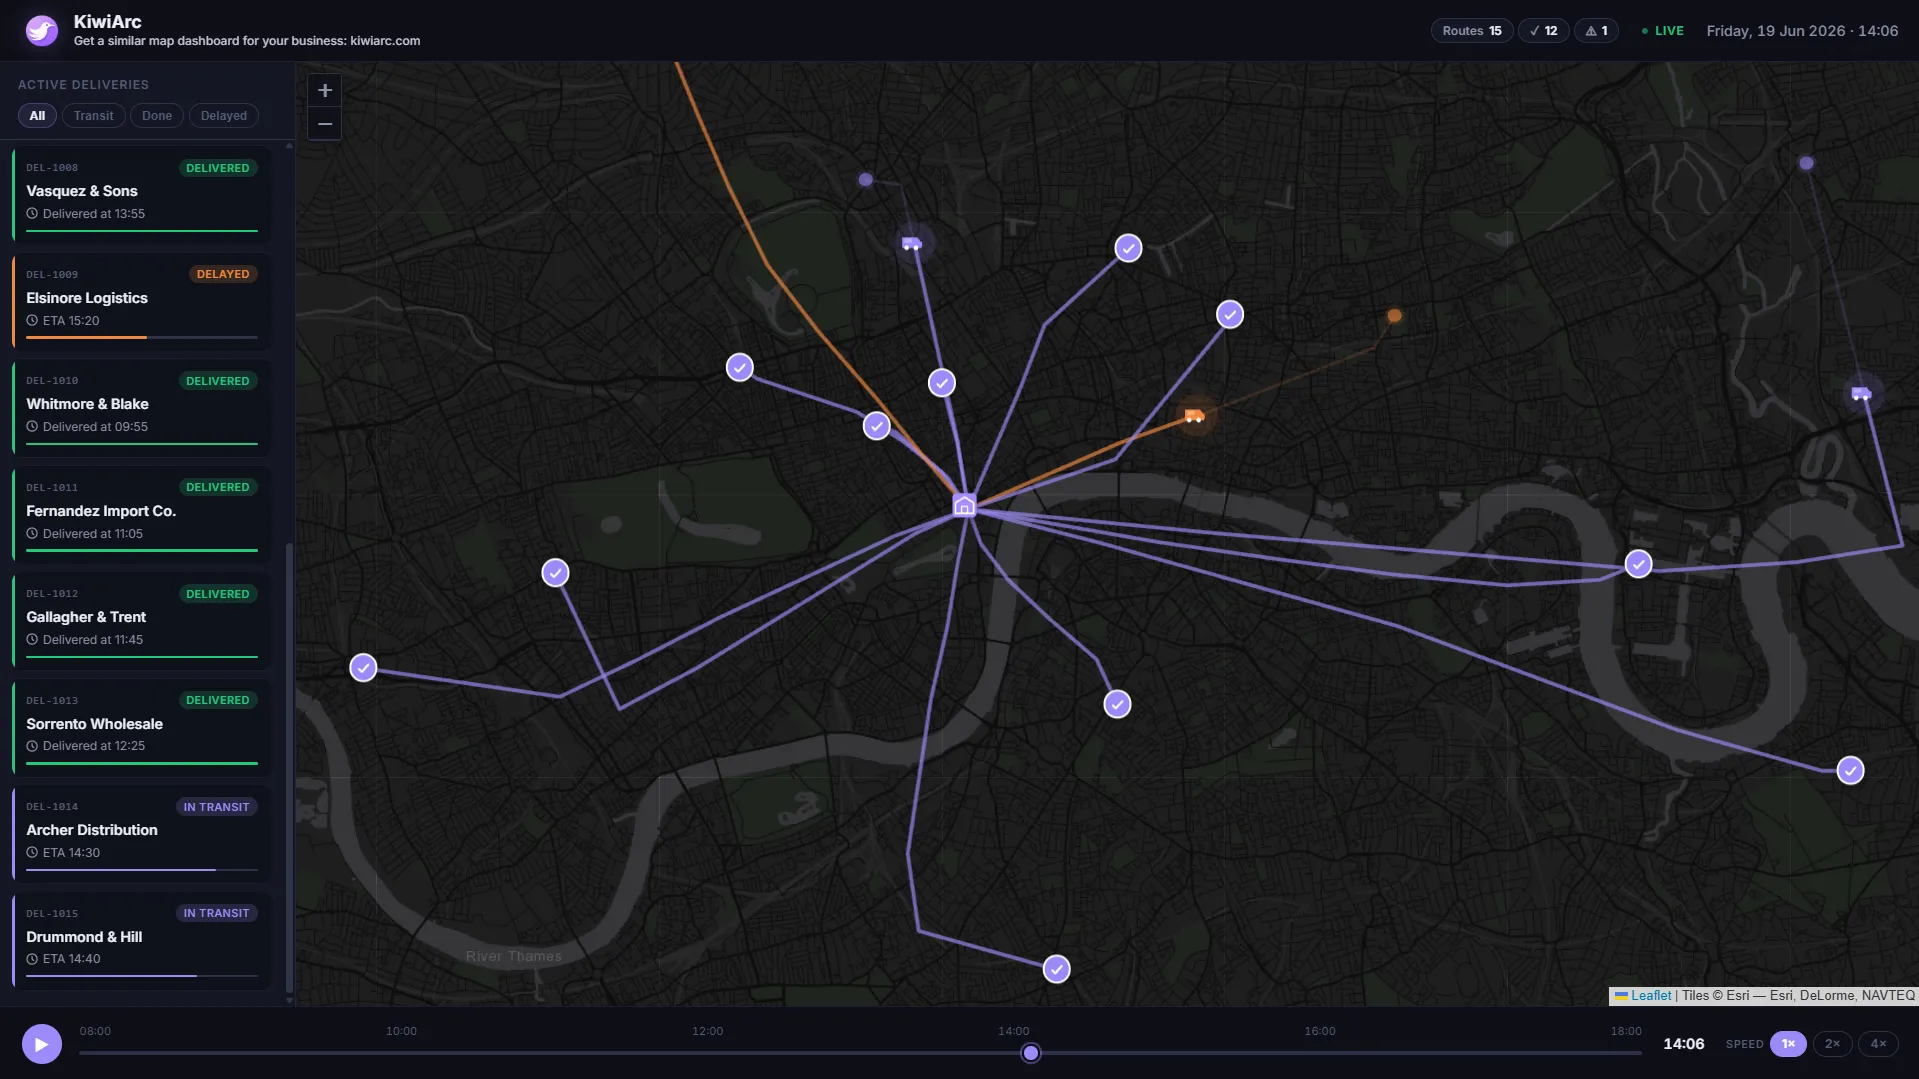
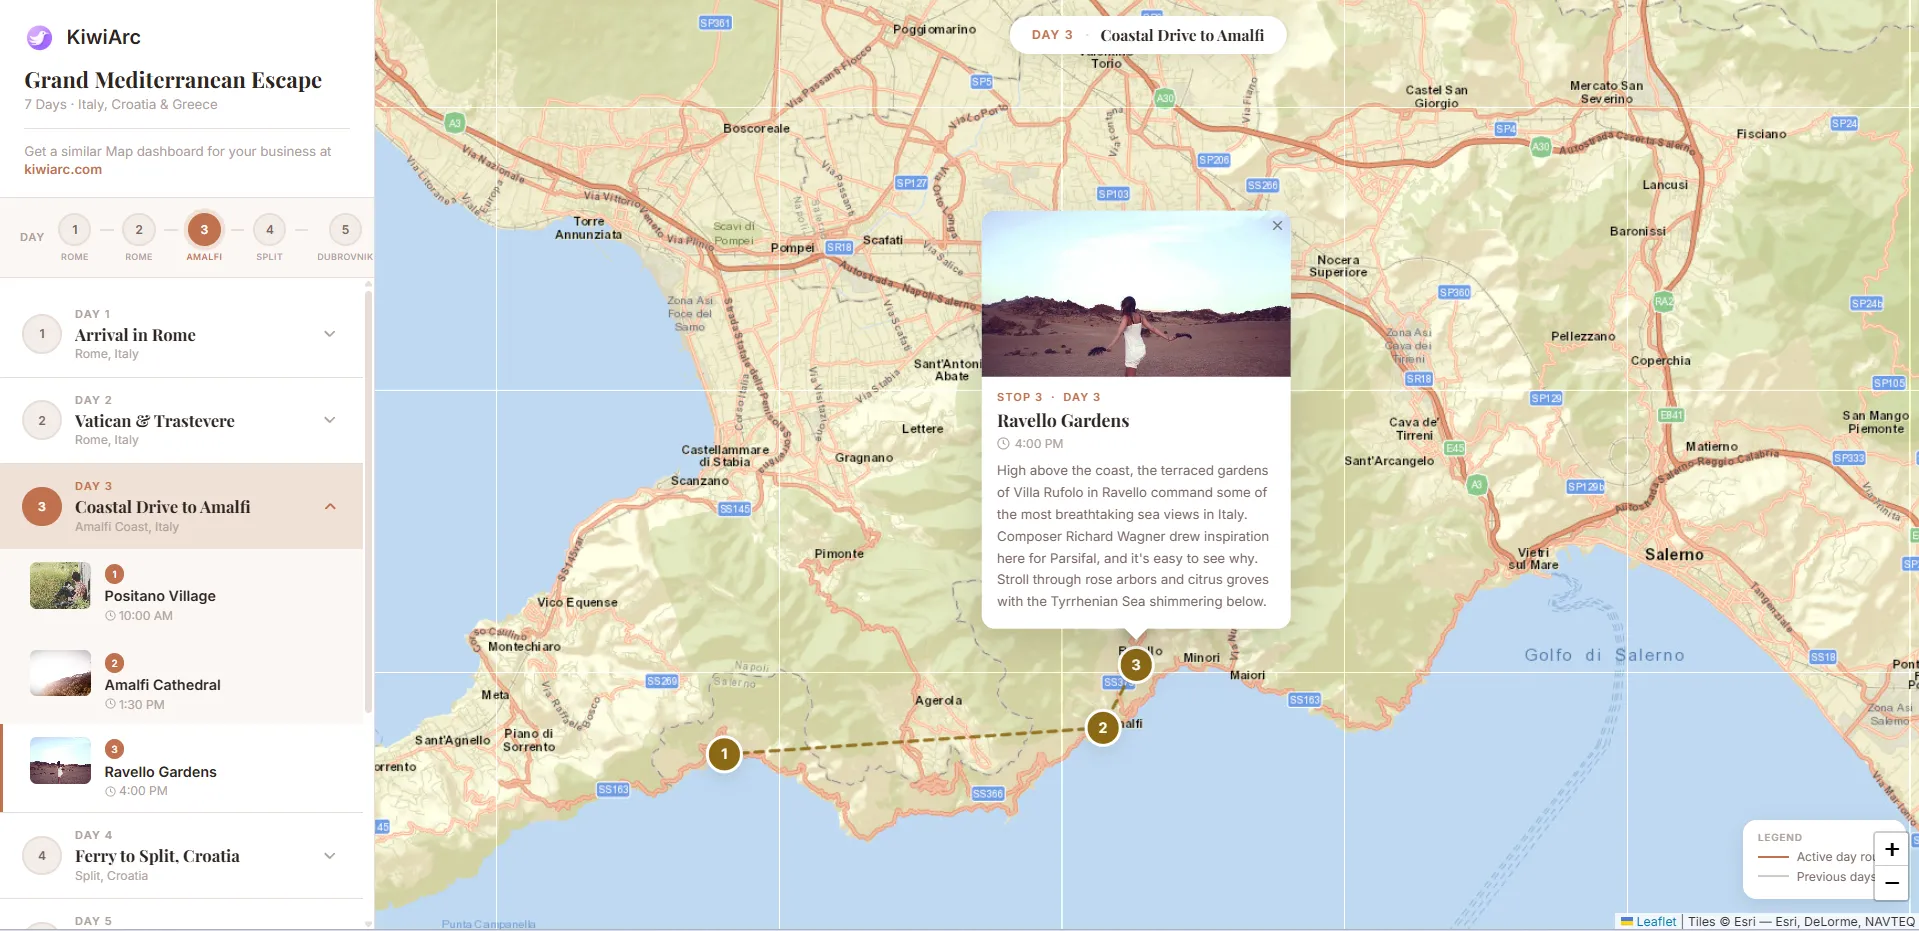
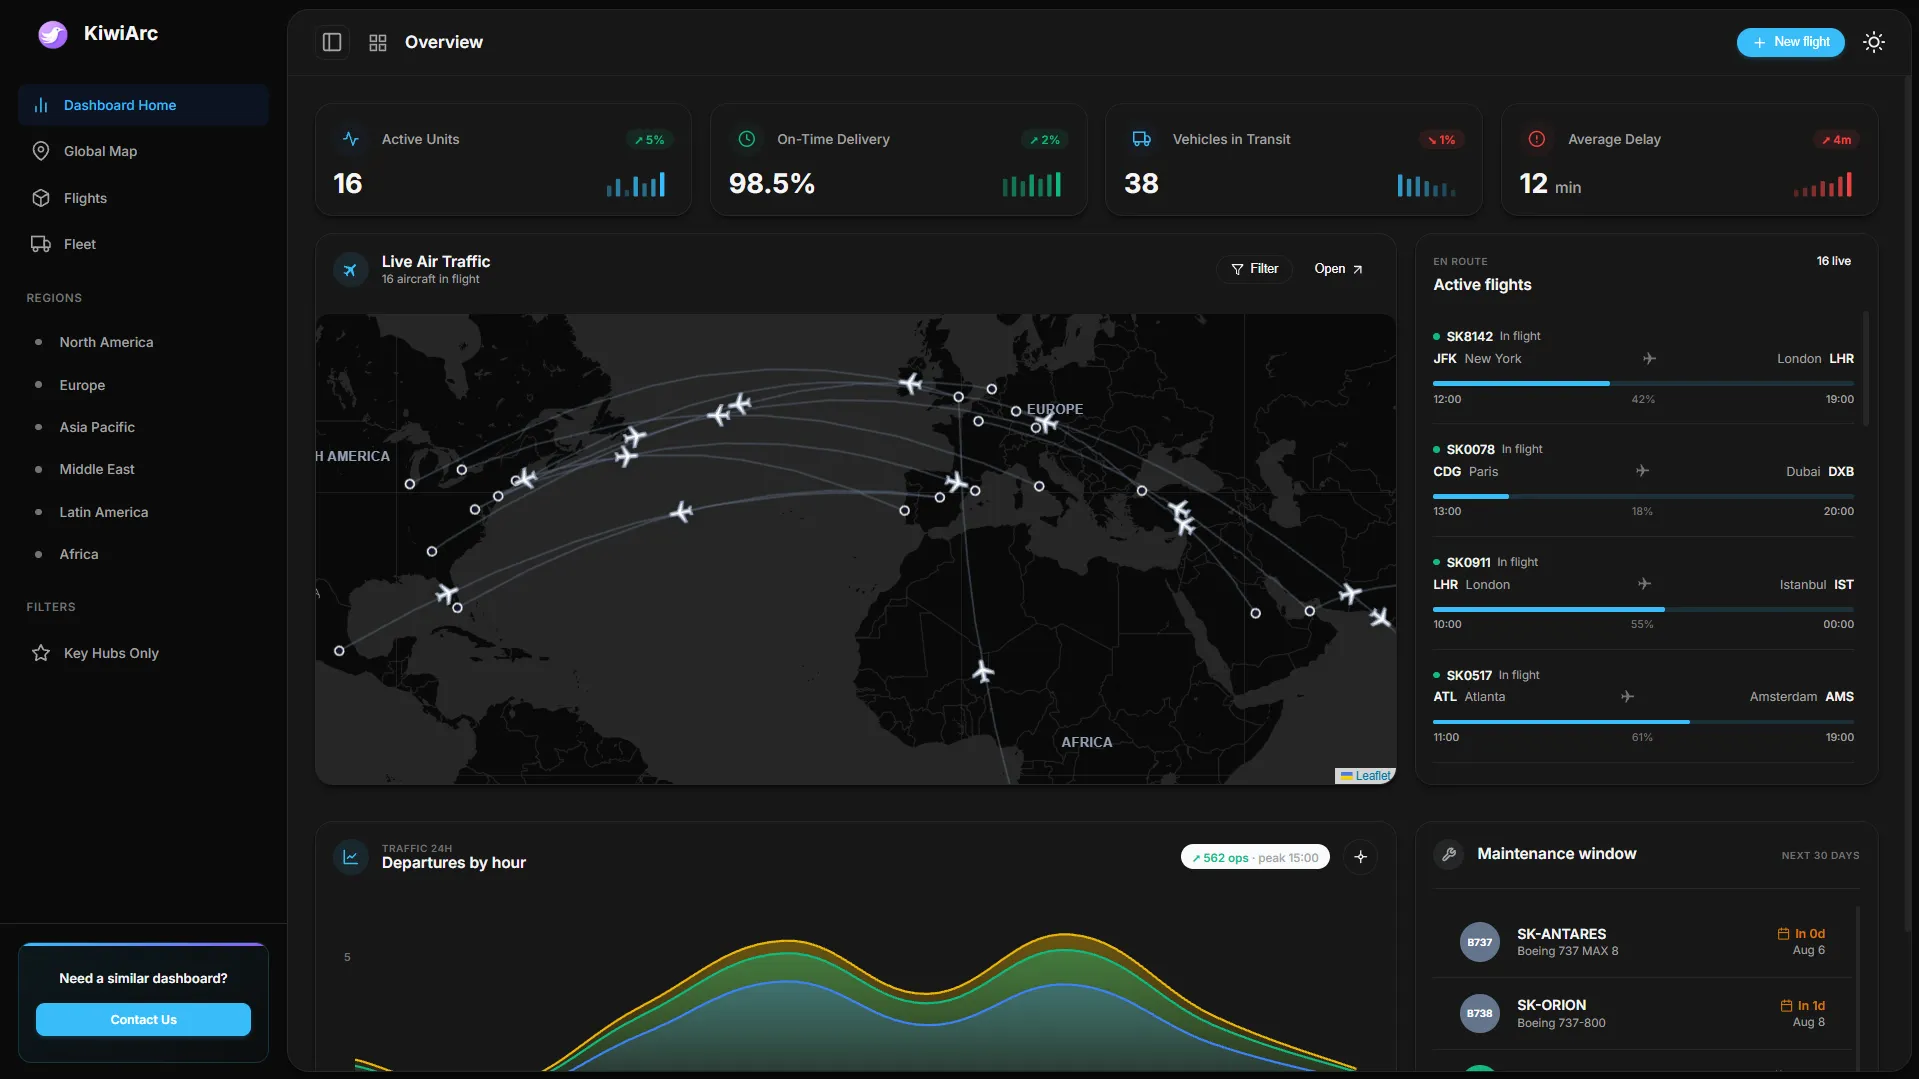







Built with clients,
trusted through results.
Real feedback from researchers, businesses, startups, and organizations we've collaborated with.
"Very good work. He added all the necessary details and made everything exactly as requested."
"Hire him. He and his team are spectacular."
"Excellent, professional, knew how to navigate the project without much instruction"
"I honestly can't give enough praise to the quality of work. Helped me with exactly what I needed, was polite, professional, and prompt. Will absolutely bring more work in the future and recommend to others."
"It was a pleasure working with! great communication, professional working standards and in-time delivery. Would definitely hire again."
"Very professional, great communication and flexible creating quality data visualizations. Highly recommend."
Pricing based
on your project.
Single Project
This package is for one focused deliverable, such as one interactive map, dashboard, or animation.
- One focused deliverable
- Multiple revision rounds
- Data preparation & processing
- Responsive adjustments / refinements
- 30 days of post-delivery support
Multi-Deliverable
This package is for projects requiring multiple connected deliverables.
- 2–3 connected deliverables
- Multiple revision rounds
- Custom data processing & integration
- Custom styling and visualization
- Extended project support
- 60 days of post-delivery support
Custom Partnership
For larger, unusual, or long-term projects. Price is tailored to your specific scope.
- Fully customized project scope
- Flexible deliverables
- Dedicated project timeline
- Large-scale GIS & data projects
- Ongoing collaboration
- Extended / priority support
Not sure which option fits your project?
Let's spend 15 minutes discussing your goals. We'll recommend the collaboration model that makes the most sense for your project.
Book a Free Discovery CallIdeas worth
sharing.

The Future of Web-Based GIS: Rendering Millions of Points in Real-Time

Designing Intuitive Dashboards for Complex Environmental Data

Why Remote Sensing is Becoming Accessible to Everyone
Latest insights on GIS, dashboards, mapping, and data visualization.
View All ArticlesQuestions,
answered.
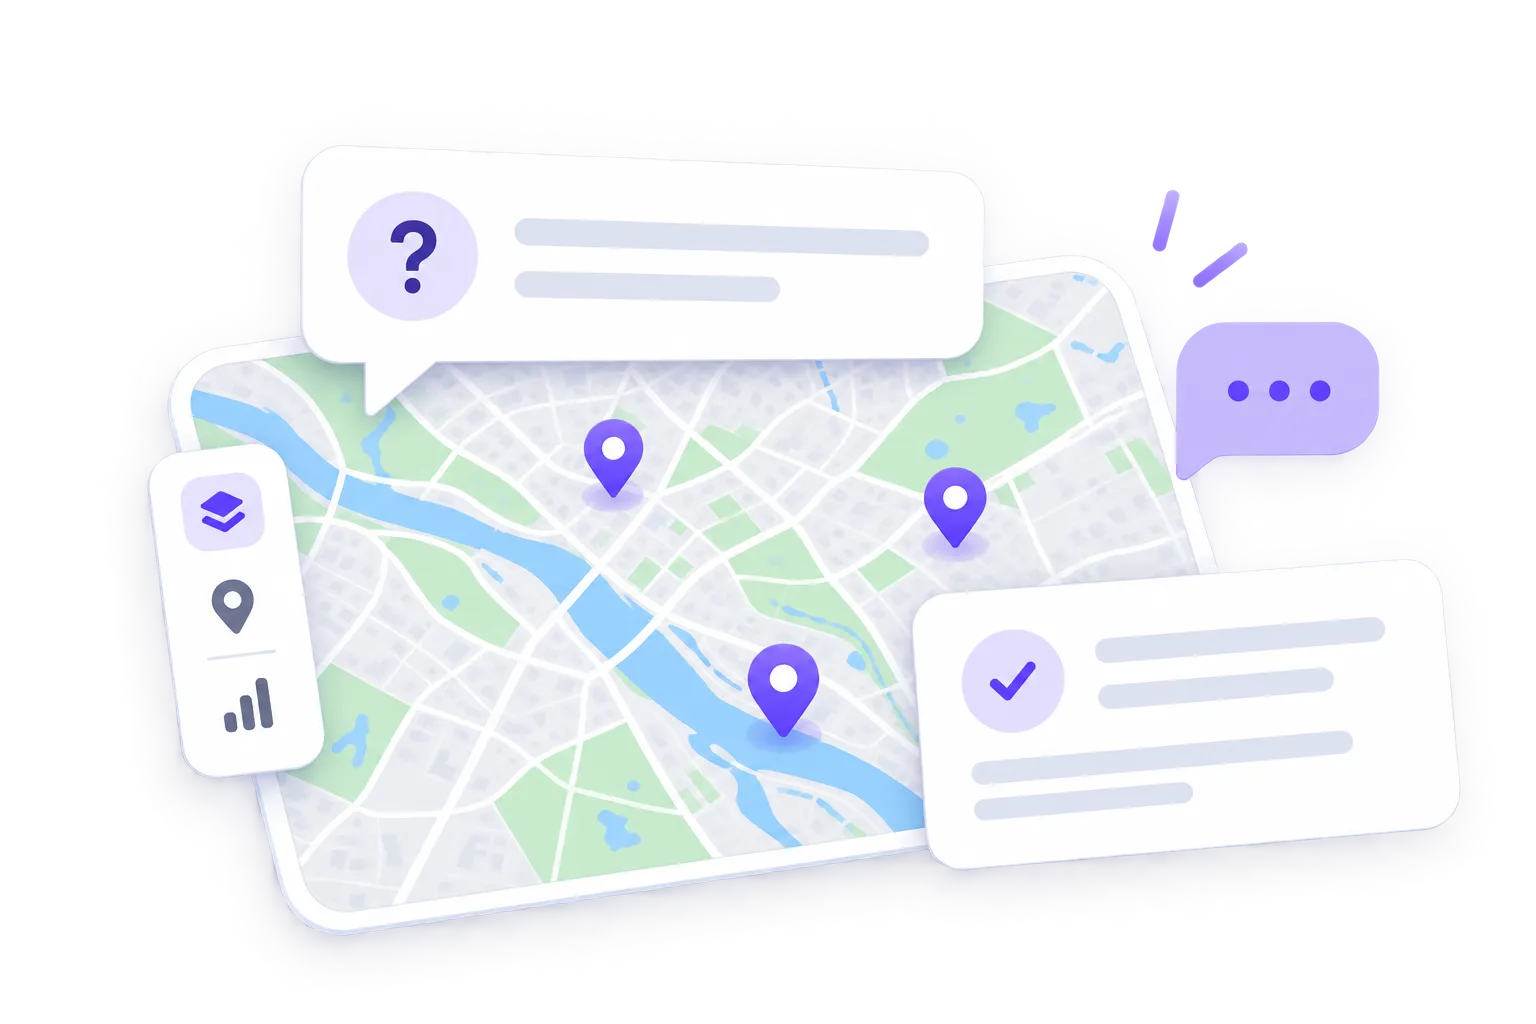
Whatever you have — spreadsheets, CSV files, APIs, shapefiles, GeoJSON, databases, or even rough notes. We'll help organize everything during the first conversation.
Yes. Maps are our specialty, but we also design dashboards and data visualizations that don't involve geography.
It depends on the scope. A simple interactive map may take 1–2 weeks, while larger dashboard, GIS, or animation projects typically take 4–6 weeks.
Both. We handle the visual design as well as the technical implementation, giving you one complete workflow from concept to delivery.
Yes. We regularly improve existing projects, whether we originally built them or not.
Most projects are designed so updated data can be integrated easily. For larger changes or ongoing maintenance, support plans are available.
No. We work with startups, researchers, universities, agencies, nonprofits, businesses, and individuals. If the project is a good fit, we'd love to hear about it.
Let's build your
next project.
Whether you need an interactive map, GIS analysis, web dashboard, or map animation, we'd love to hear about your project and help you choose the right approach.